Overview of Valido Visual Validation for ecommerce
Introduction to the Visual Validation
What is the visual validation?
Visual testing, in simplest terms, is verifying that everything appears correct, or as intended.
In ecommerce, visual testing is the process of detecting and reviewing visual UI changes of an online store. It is a quality assurance activity that specifically focuses on ensuring that an online store’s UI appears as intended for the end user, whether he/she is browsing a product listing on a desktop or making a purchase on a mobile website.
How is Visual Testing performed?
When we talk about visual testing and visual validation, we are checking that visual elements that belong to a page are visible to the user and they appear correctly in terms of its size, color, brightness, contrast, density, texture, weight, shape and position in relation to the user viewport.
It also makes sure that visual elements are not overlapping one another, causing them to be hidden or poorly visible. It is also to verify that the visual experience is consistent across all users.
It is important to note that visual testing is not merely about checking the UI. In particular for online stores, it is also necessary to verify that user interactions with the site return the expected results from both a functional and visual perspective.
Valido Visual Validation Tool
Valido offers the perfect tool to performe the visual testing. It is composed by two main tabs:
- The visual validation dashboard
- The visual tests
The Dashboard
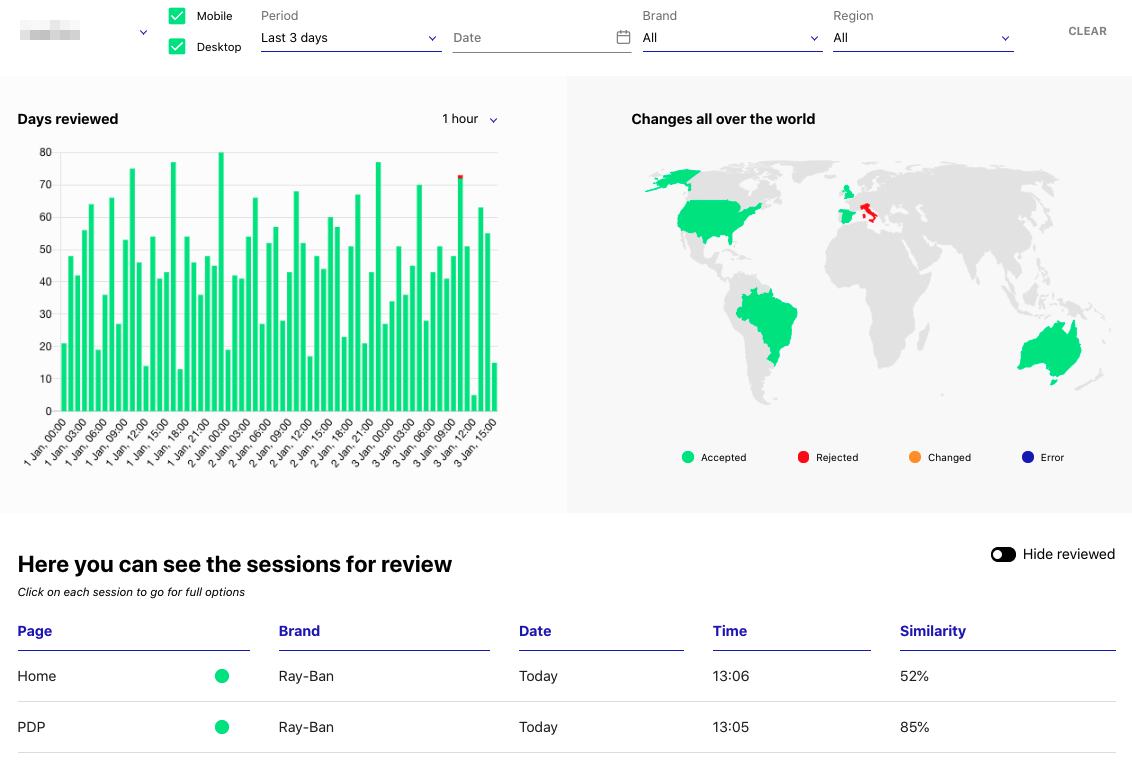
Our latest version of the dashboard:

The filters
The filters bar allow you to enlarge or reduce the set of data visualized in the components showed just below. In particular, it is possible to:
- Select the specific account (if you have multiple)
- Select the devices
- Select the period of time
- Select the brand (if you have multiple)
- Select the region
Legend of colors
It is foundametal understand the colors used through the app:
- green: the validation execution found the expected level of similarity. Everything sounds good.
- changed: the validation execution found an unexpected level of differences in one or more e-commerce pages. It needs to be reviewed.
- red: the validation has been marked as rejected because the changes or changes were not expected.
- blue: a general error (eventually related to the configuration) did not allow to execute the validation.
Days reviewed
It is an histogram visualizing your e-commerce tests executions- marking them with different colors- arranged by the preferred time unit (1 hour, 4 hours, 8 hours, 1 day).
Changes all over the world
It is a world map showing- with different colors- the status of your e-commerce test executions grouped by Country. Even one not accepted execution will cause the Country to get a different color than the Valido-green.
Sessions for review
List of e-commerce pages need to be reviewed because in their execution has been detected at least a change. When the "hide review" toggle is disabled, it will be possible to list all the executions despite their state. In particular the table, consider for each execution:
- the brand
- the execution date
- the execution time
- the similarity respect the expectation
Brand tests
E-commerce pages (considered by your tests) arraged by brand. Opening the detailes, different exeuctions are rendered ordered by day and time.
The Tests section
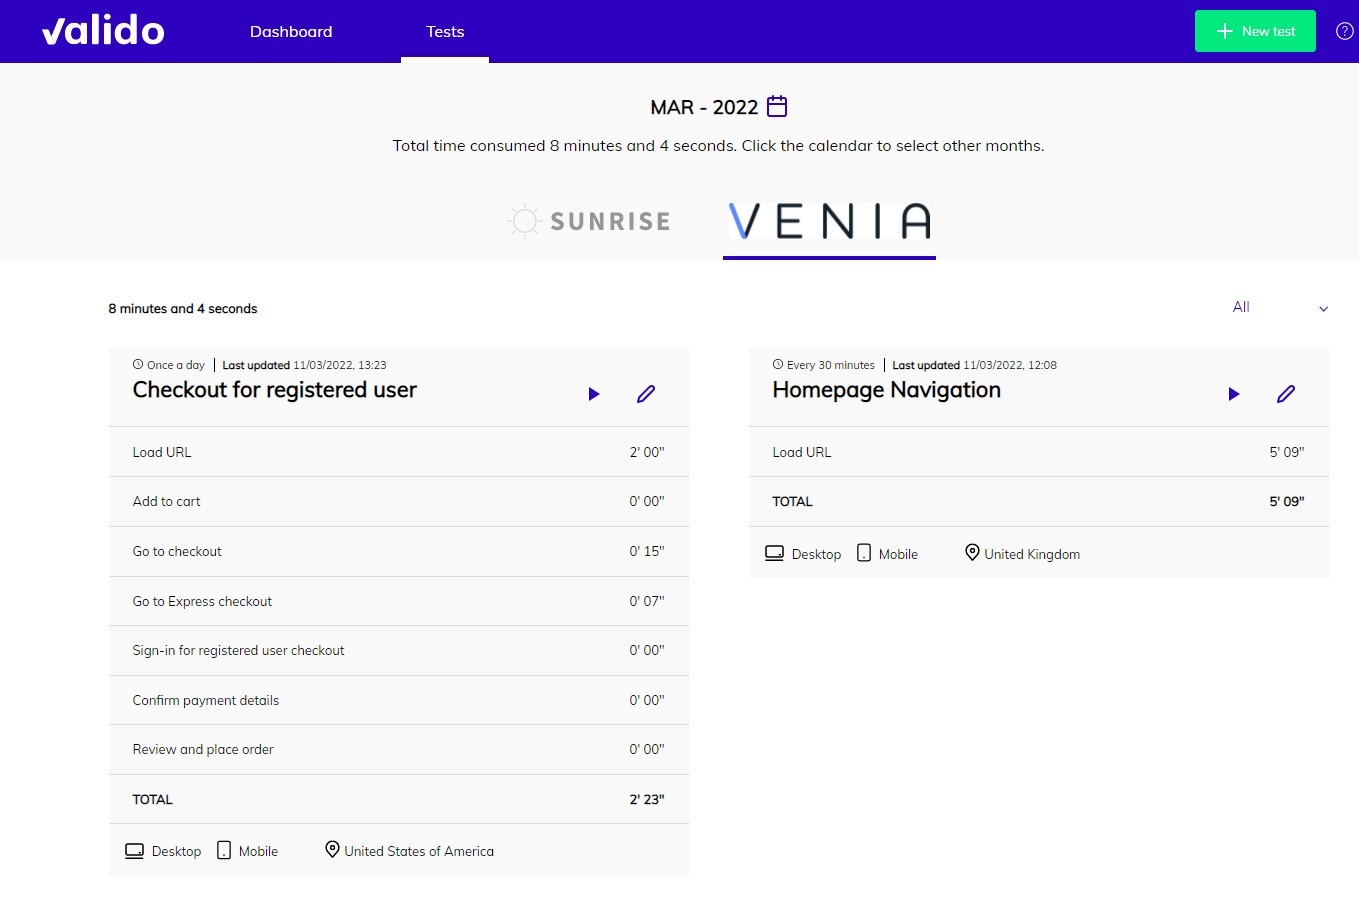
In addition to the Dashboard, there is also a "Tests'' section. Here you can review all the current tests that have been created and scheduled. You can also view the consumption of execution minutes related to each brand and test flow.

The Tests section contains the following elements:
- Month selector
- Total consumption / usage time of all the executed tests for the account for the selected month
- Brands configured under the account
- Subtotal consumption time for all the executed tests belonging to the selected brand
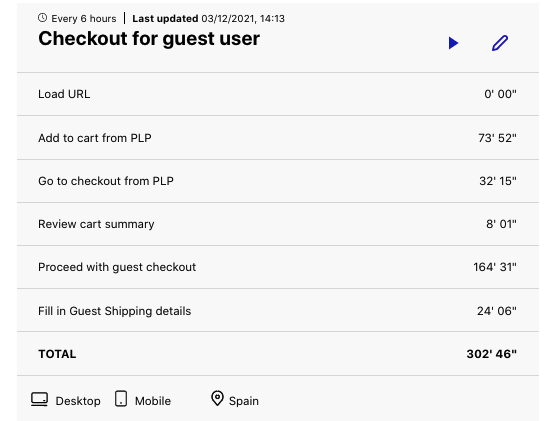
- Summary of each created test flow: behaviors configured, execution frequency, devices and countries tested, and the respective consumed time
- Test flow “play” and edit buttons
Reviewing the consumption data by month
The month selector allows you to choose the particular month to review consumption data, with the current month being the default view. The selector allows you to view:
- The total time consumed for all brands for the selected month
- The total time consumed for a particular brand, for the selected month
- The execution time consumed by each behavior (and the corresponding actions under it)
With the consumption data, you can track and always be aware of the execution time consumed for your tests.
Reviewing the test flows by brand
If your account consists of more than a single brand, the Tests section also allows you to toggle between the views of the different brands. Each brand view displays all the test flows created for that brand. You can review:
- The scheduled frequency of each test flow
- Last updated - the timestamp of the most recent change to the test configuration
- The corresponding behaviors for each test flow
- The devices and countries to be tested for each test flow

Play button and Edit test options
For each test flow, there are two visible buttons in blue.
The “play” button allows you to perform an ad hoc execution for the corresponding test flow, without having to wait for the next scheduled execution to obtain the validation results.
The “pencil” button allows you to make edits or updates to the test flow configuration. Clicking this button will bring you to the Tests Editing section, which we will explain in detail in the corresponding tutorial section.